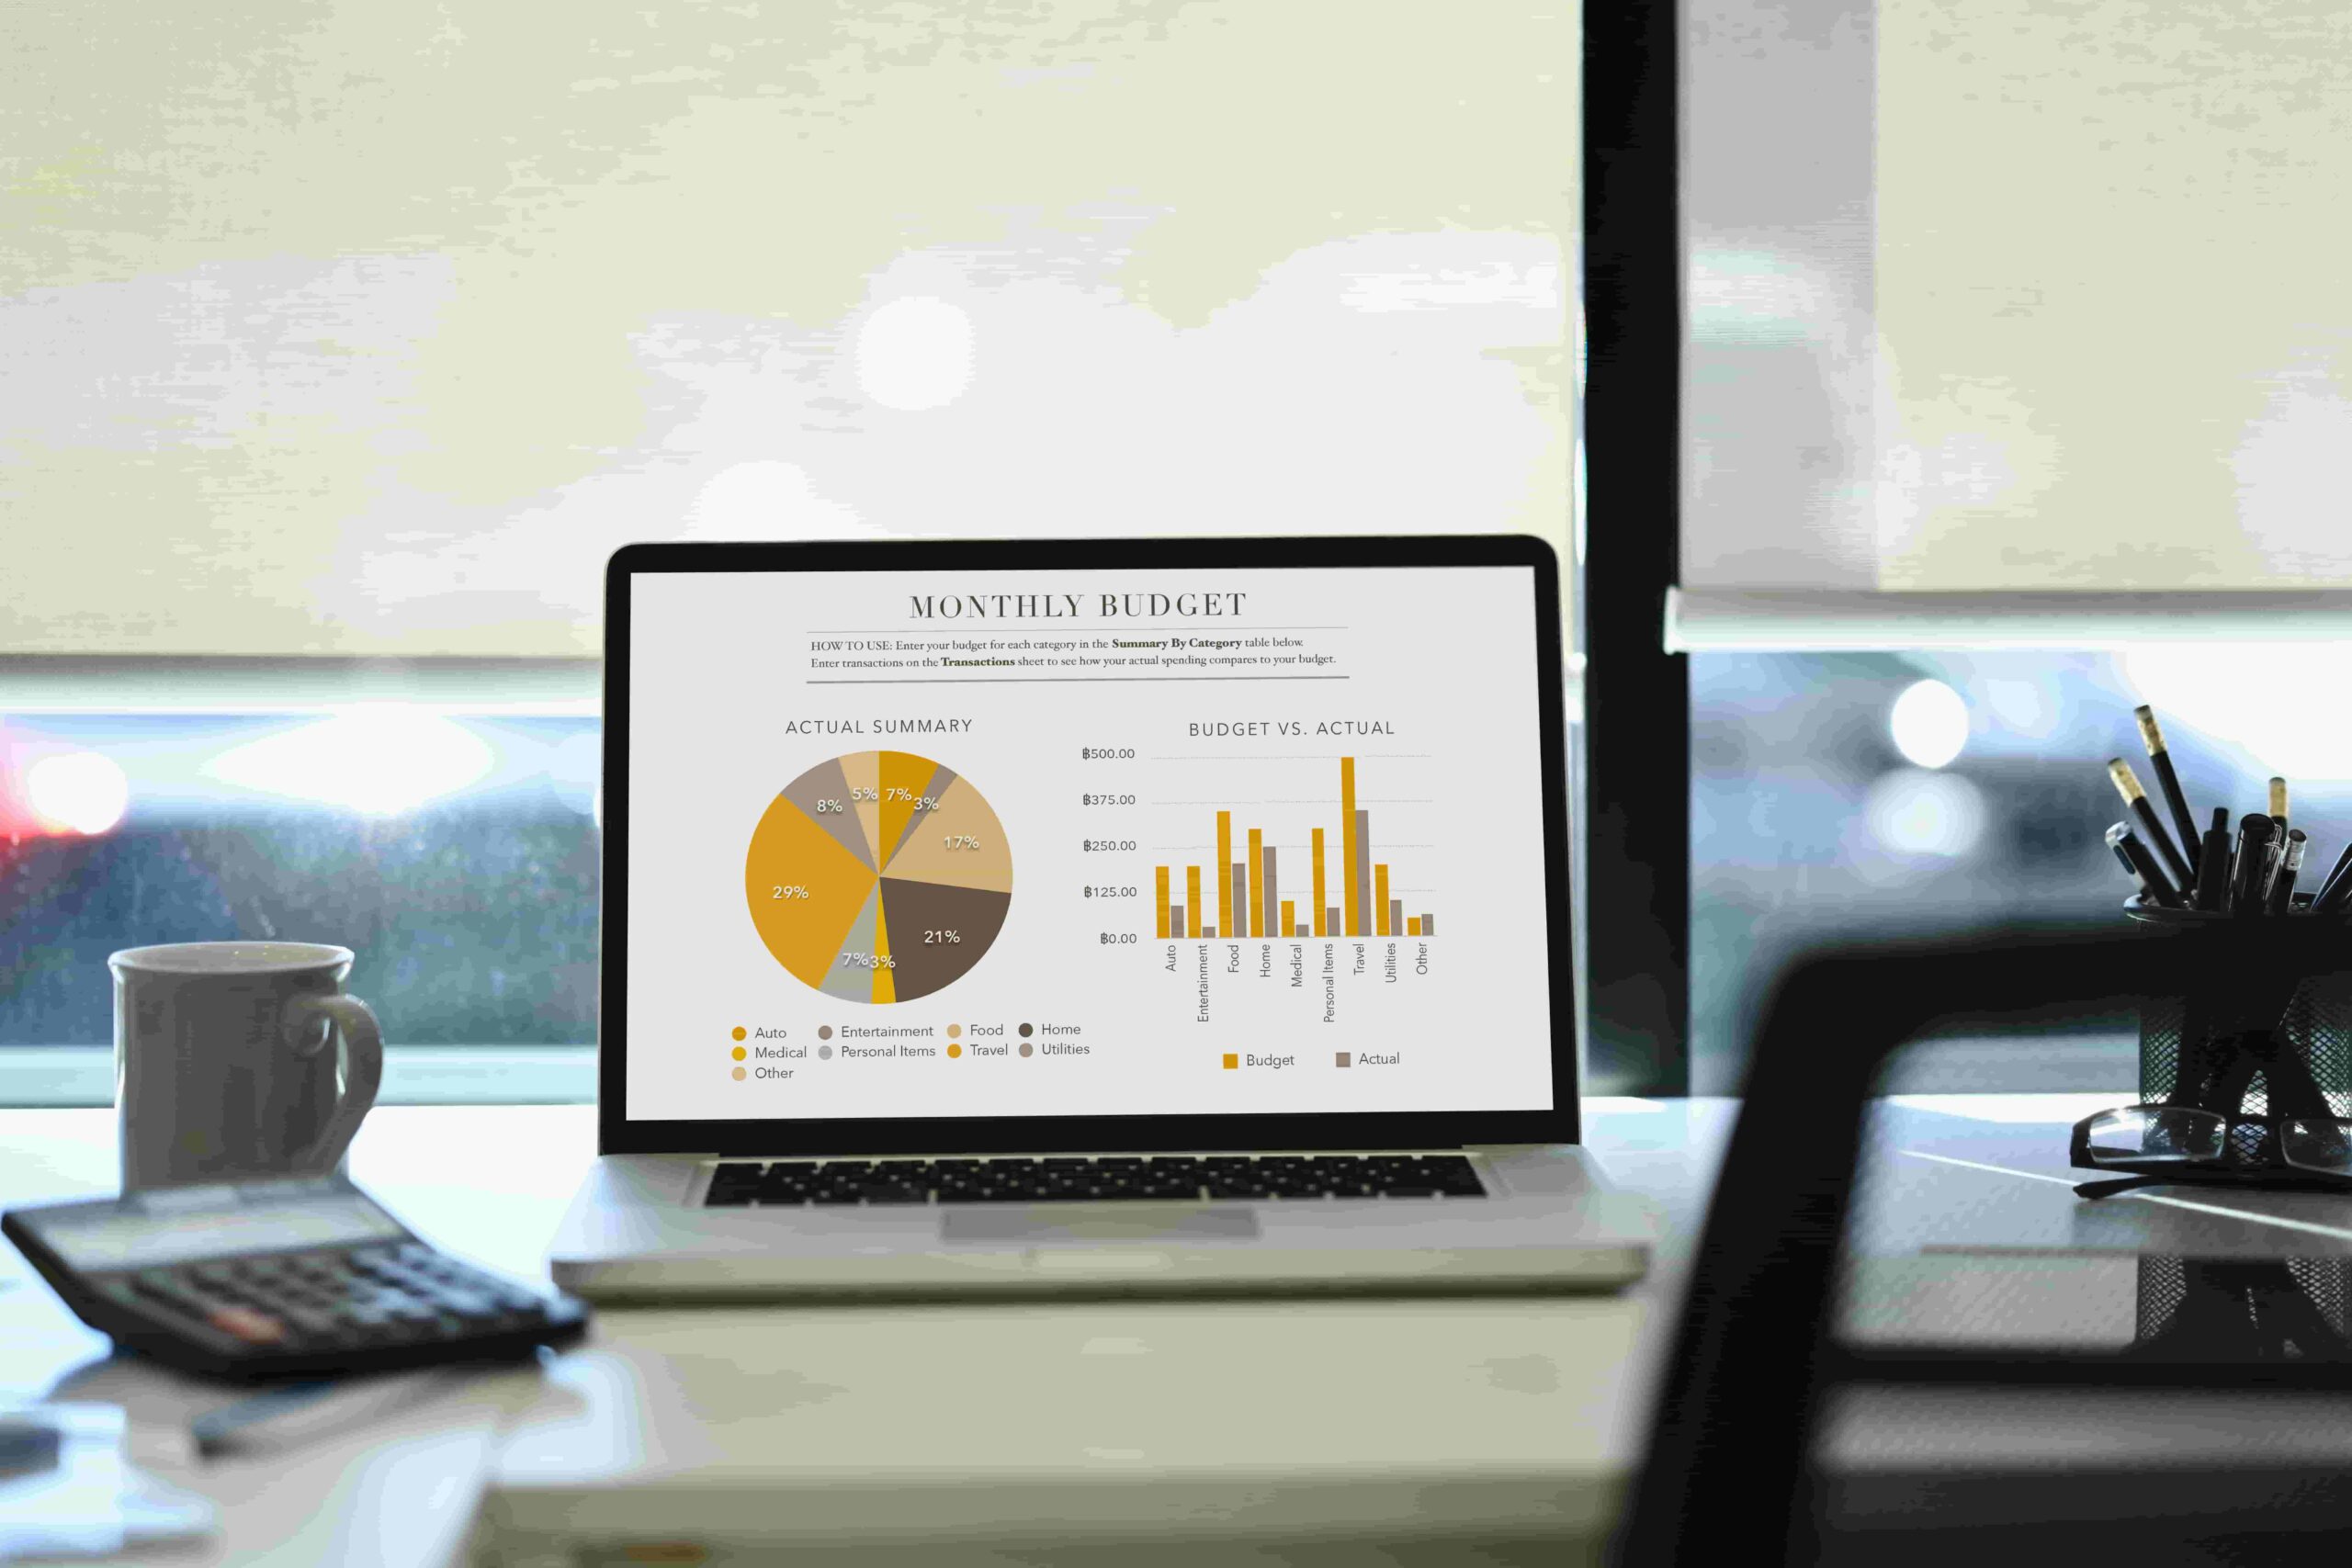
Data Visualisation Service: Empowering Smarter Decisions
In the era of big data, businesses generate vast amounts of information every day. Without the right tools, valuable insights remain hidden in raw figures and spreadsheets. A data visualisation service bridges this gap by converting complex datasets into intuitive, easy-to-understand visual formats, enabling better analysis and decision-making.
When executed effectively, data visualisation goes beyond charts—it tells a story. It reveals patterns, trends, and relationships that might otherwise remain invisible, helping organisations act with confidence.
The Role of a Professional Data Visualisation Service
A robust data visualisation service does more than create graphs. It combines data engineering, design expertise, and business intelligence to ensure the output is accurate, insightful, and tailored to decision-makers.
Core components include:
- Data Preparation – Cleaning, structuring, and integrating data from multiple sources.
- Tool Selection – Choosing platforms like Power BI, Tableau, Qlik, or custom-built dashboards.
- Custom Dashboard Development – Providing real-time, interactive data views.
- Performance Optimization – Ensuring fast, responsive visualisations for large datasets.
- Ongoing Support – Updating and maintaining dashboards as business needs evolve.
Why Businesses Need a Data Visualisation Service
Better Insights, Faster
Visualisation helps stakeholders grasp complex information quickly, enabling timely decisions.
Enhanced Communication
Clear visuals make it easier to share data-driven insights across technical and non-technical teams.
Increased Engagement
Interactive dashboards encourage users to explore data and uncover deeper insights.
Data-Driven Culture
A good visualisation service fosters a workplace where decisions are backed by evidence rather than guesswork.
Data Visualisation in the Cloud Era
Cloud-based data visualisation services integrate seamlessly with platforms like Microsoft Azure, AWS, and Google Cloud. This approach allows businesses to:
- Scale effortlessly – Handle growing datasets without performance loss.
- Enable remote access – Teams can view dashboards anywhere, anytime.
- Integrate AI & ML – Incorporate predictive analytics for forward-looking insights.
For example, integrating Azure Synapse Analytics with Power BI can provide real-time business intelligence that updates as new data arrives.
Industry Applications of Data Visualisation
- Manufacturing – Connecting production machinery with ERP systems for real-time monitoring.
- Retail – Integrating point-of-sale systems with inventory management and customer analytics tools.
- Healthcare – Linking patient data systems with AI-powered diagnostic platforms while meeting NHS compliance standards.
- Finance – Connecting core banking systems with fraud detection, CRM, and compliance monitoring tools.
Challenges in System Integration
- Finance – Real-time monitoring of market trends and portfolio performance.
- Healthcare – Tracking patient outcomes, resource allocation, and operational efficiency.
- Retail – Analysing sales trends, customer behaviour, and inventory levels.
- Manufacturing – Monitoring production metrics, downtime, and quality control.
- IT Services – Tracking system performance, security incidents, and project KPIs.
Overcoming Challenges in Data Visualisation
While powerful, data visualisation must be approached carefully:
- Data Quality Issues – Poor data leads to misleading visuals.
- Overcomplicated Designs – Cluttered dashboards reduce clarity.
- Security Concerns – Sensitive data requires strict access controls.
A professional data visualisation service ensures these challenges are addressed through strong governance, user-friendly design, and secure architecture.
The Future of Data Visualisation Services
Emerging technologies are pushing data visualisation forward with:
- Augmented Analytics – AI-driven insights embedded into dashboards.
- Natural Language Queries – Allowing users to ask questions in plain English and get visual answers.
- Immersive Visualisation – Using AR/VR to explore complex data models interactively
Conclusion
A well-executed data visualisation service transforms raw numbers into strategic intelligence. By combining advanced tools, skilled design, and cloud integration, businesses can unlock the full potential of their data, making smarter, faster, and more confident decisions.
For organisations aiming to compete in a data-driven economy, investing in professional data visualisation services is no longer optional—it’s essential.

